“When you can measure what you are speaking about, and express it in numbers, you know something about it, when you cannot express it in numbers, your knowledge is of a meager and unsatisfactory kind; it may be the beginning of knowledge, but you have scarely, in your thoughts advanced to the stage of science.”
Lord Kelvin
Predicted South African Population for a Year
You'll get the total population, white population and percentage of the white population of the total population.
You can use the left and right keyboard arrows to make single year adjustments
...Do not prophesy to us the truth! Speak to us pleasant words; prophesy illusions.
Isaiah 30:10 Majority Standard Bible
About the South African Population
In 1911, whites comprised 22.7% of the total population of South Africa. In 1985, this percentage was down to 17.5%. By the 2022 census, it had plummeted to 7.3%. Of course, conditions from 1911 to 1985 were very different from those between 1985, when the writing was already on the wall, and 2022. For that reason, I use 1985 as the starting point to calulate population growth rates. As an aside, the 2022 census was criticised for getting white and Indian populations too high.
This site is about giving you an idea about what's coming.
Under the hood
This site is backed by one database table with three columns: year, white population, and total population. The first row contains census statistics for 2022. The populations for 1985 won't change, so they are hard-coded into the Groovy code and are always used as the starting populations. Say you search for a certain year, first, the application looks to see if there's not already a census for that year in the database. If there is, the populations are returned, and the white population is divided by the total population. That fraction is multiplied by 100 and rounded to one decimal.
If there's not, the population figures for the last census in the database are obtained and the year distance from 1985 is calculated. That's the years during which the population grew/shrank from 1985 to the year of the latest census. The more years, the more representative the calculated rates are of the true growth/shrink rates for the two population groups used here. That's done by getting the natural log (based on Euler's number) of (the latest population divided by the 1985 population) all divided by the growth/shrink years. That rate is used to calculate the two group populations, white and total, for years not in the database. That's done by multiplying the relevant 1985 population by Euler's number raised to the power of (the relevant 1985 population times the relevant growth/shrink rate) rounded to an integer. That's not too complicated, is it? Just see how fast the computer does it. This application runs at one the Amazon Web Services locations in the USA. When you click "Search," your year selected is sent there, the server uses your year to get an answer and sends the response back to you where AJAX writes it to the page on your computer without reloading the page.
Different predictions from elsewhere
There are predictions for the future population of SA not in keeping what the calculator calculates. In all cases they take factors into account, like decreased fertility in the future, which are based on not much more than guesses. This site calculates a growth/decline rate based on the figures of the 1985 and the latest available census in the database. From that, it calculates populations into the future. Nothing else is taken into account. Numbers are numbers and guesswork is guesswork.
Carrying capacity (the number of people an area can support) is not taken into account as the carrying capacity of South Africa, as said in the previous paragraph, is anyone's guess. South Africa is 32% larger than Nigeria, and Nigeria's 2026 population is/was 240 million. That's a nearly four times larger population than South Africa for the same year.
Census-based Data
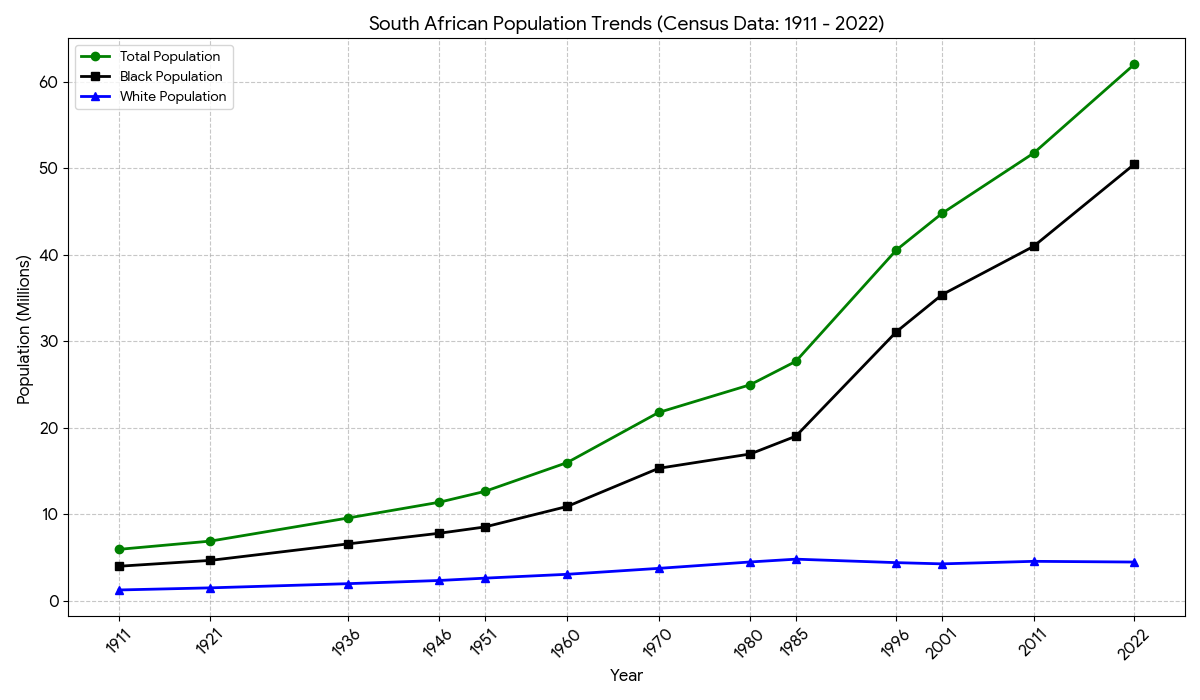
Google's Gemini AI generated the above image
You will see that the above graph shows no sign of a slowing of either the black or total population. But the situation is very different for the white population.
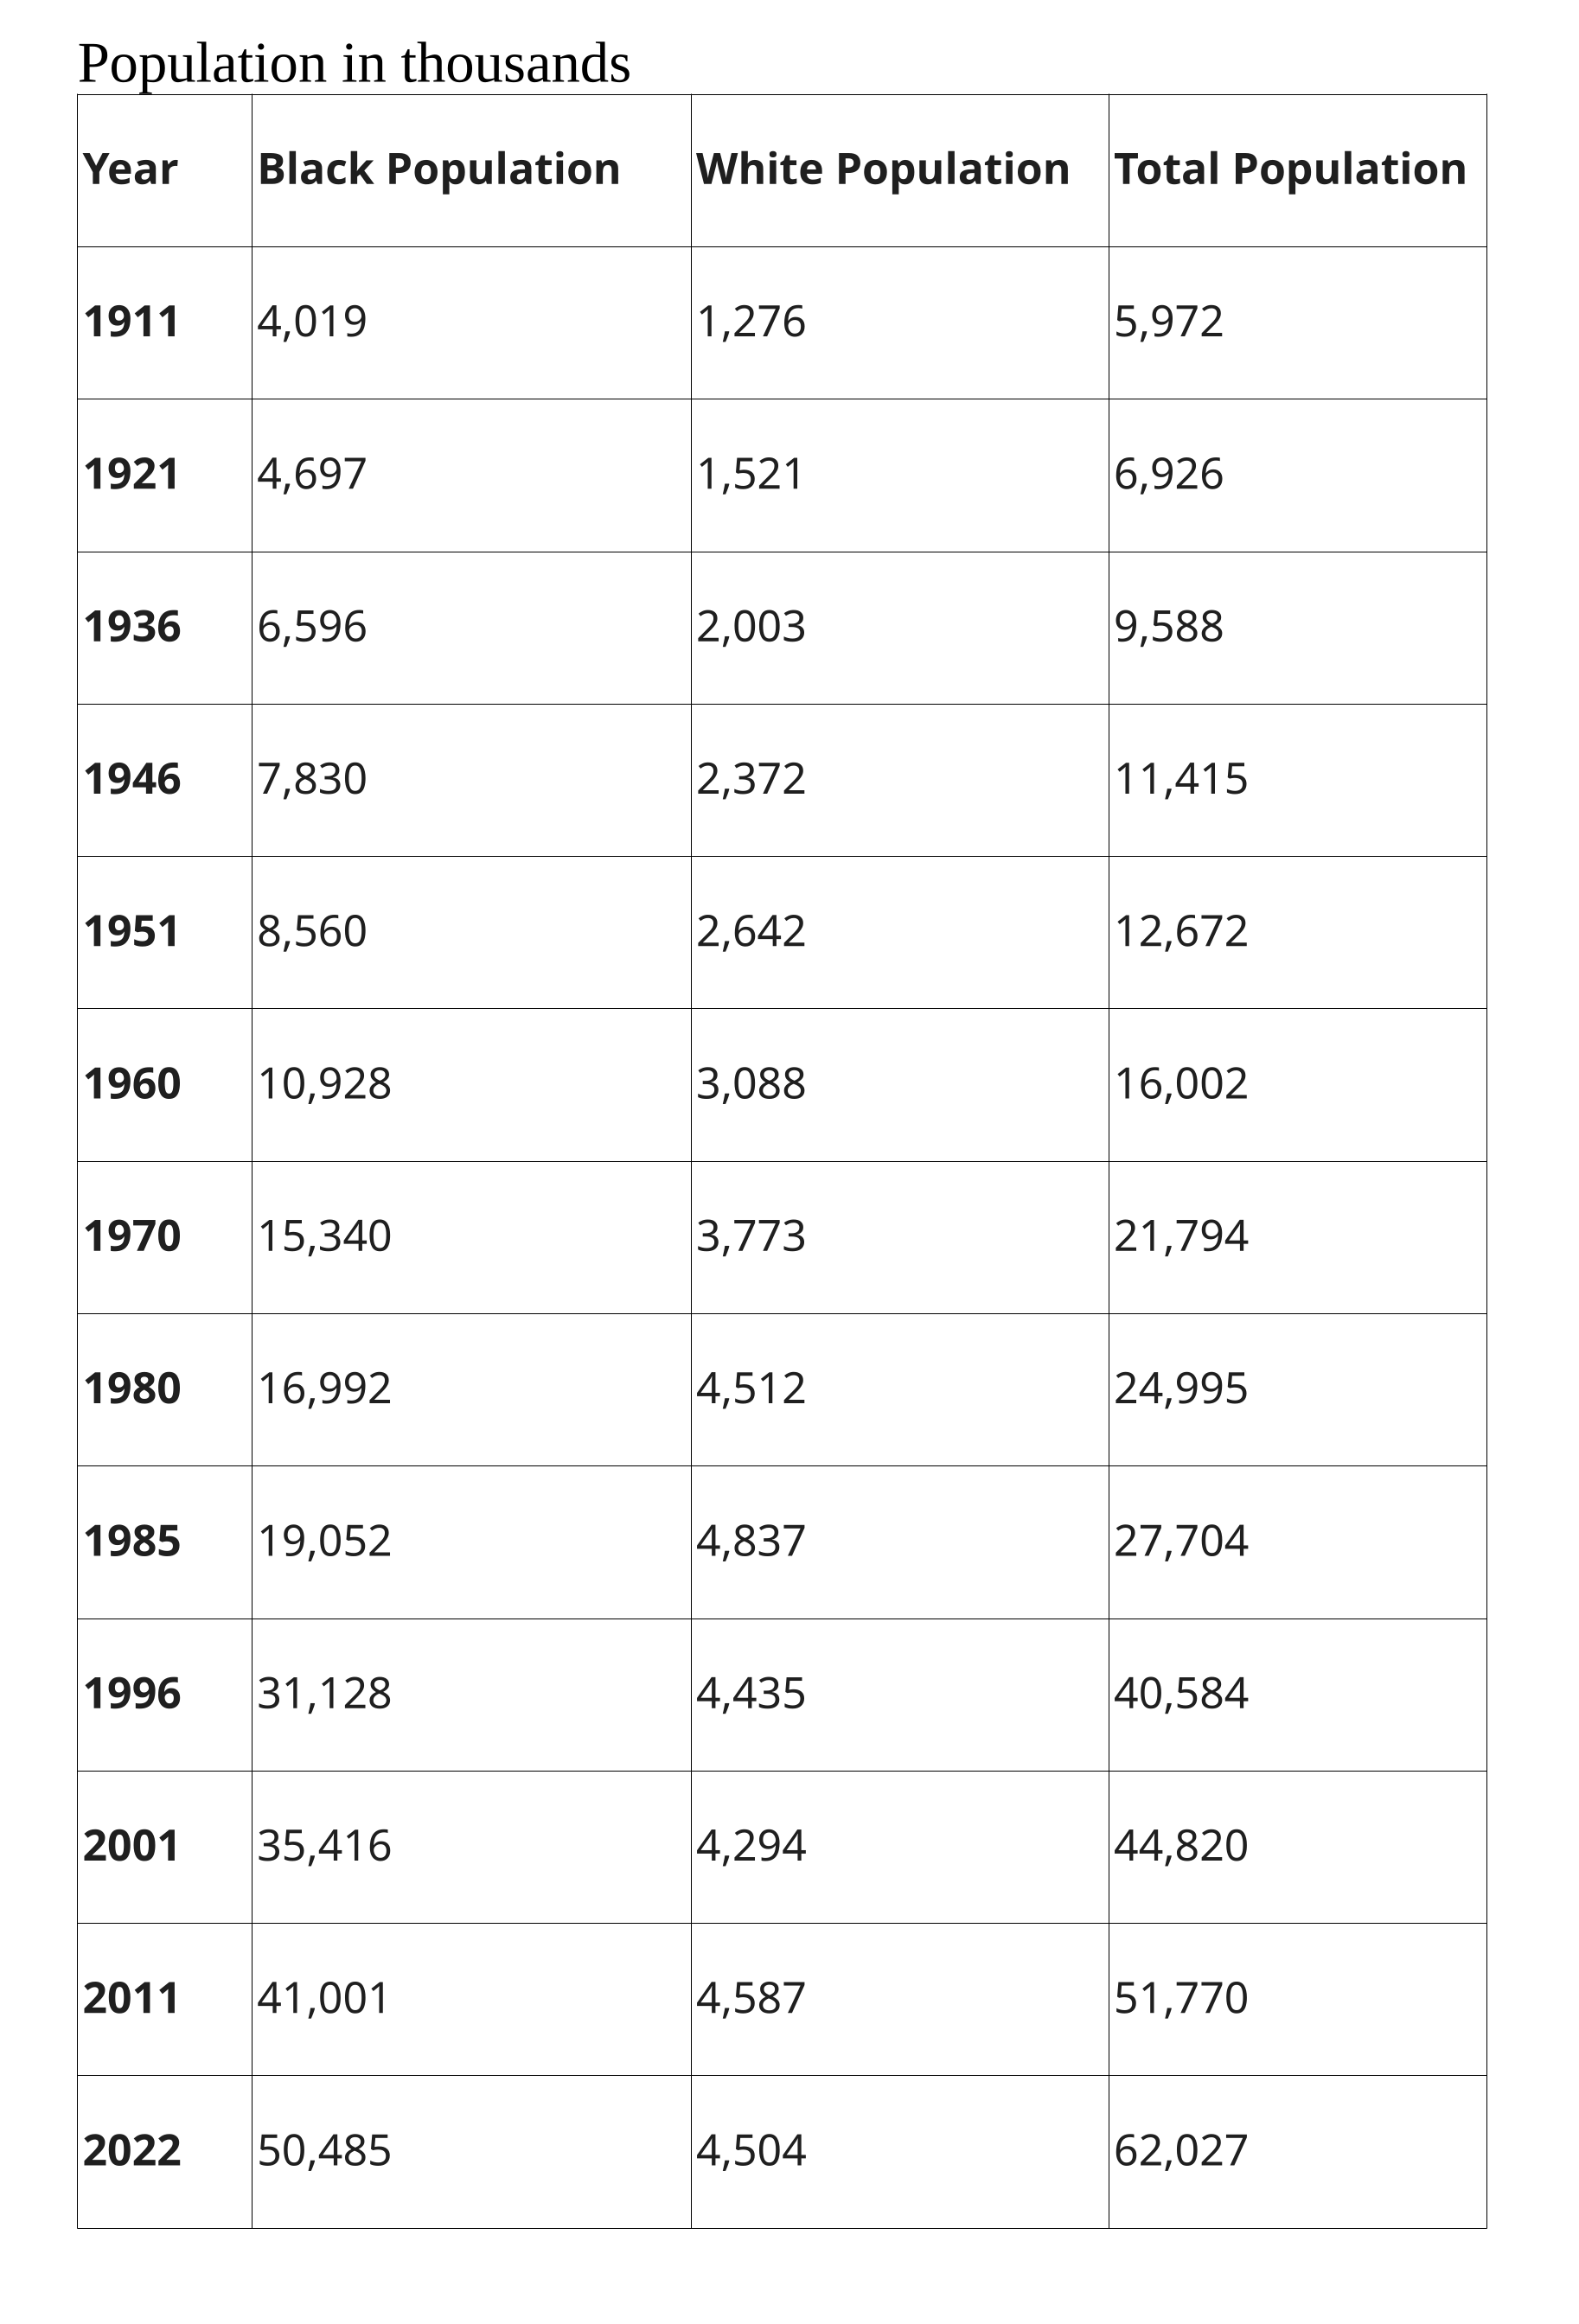
Google's Gemini AI generated the above table
The numbers above are what's on the graph above them. They tell the same story. Note that the white population in 2022 was lower than in 1980.
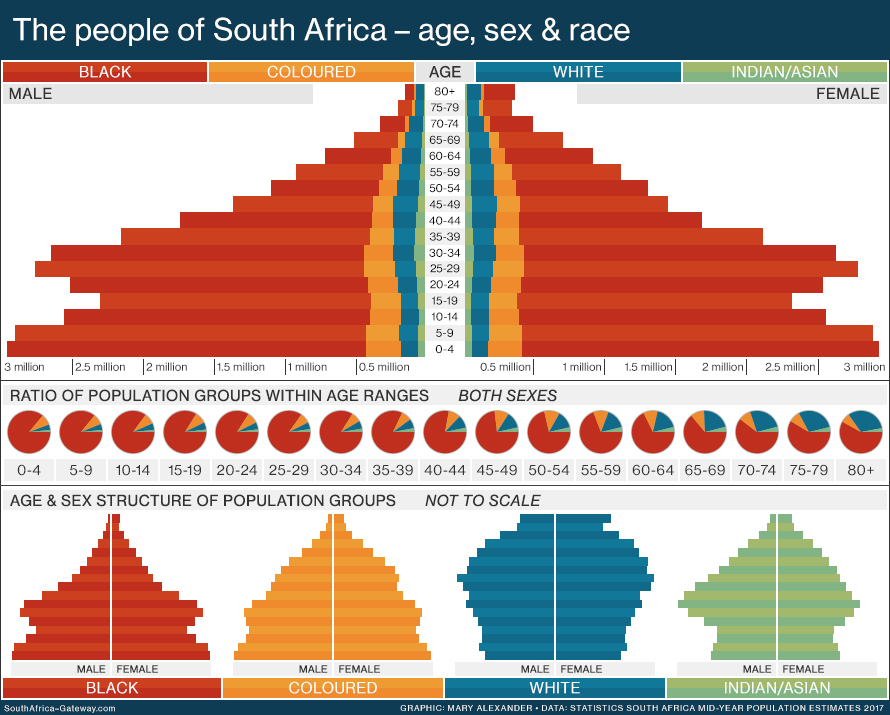
This image is licensed under a Creative Commons Attribution. The image is unchanged.
While the black and coloured populations have a broad base of young people, people who are going to have children in the future, the whites and Indians have few youths who will replenish their numbers in the future. The meaning of this is clear.
Near the top of the pyramid the blacks become far fewer while the whites become much more prominent. At the over 80 age group w hites comprise between 20 and 30% of the population. But alas, they won't influence the future of whites in South Africa much.
What the future holds for whites in South Africa

I hold the Native Question to be the root question in South Africa, and as is our wisdom in dealing with it, so will be our future...
Olive Schreiner, author of The Story of an African Farm. About 1908.
If this woman could see problems coming in 1908, the governments should have seen it, too. One expects those in charge of a country to be the country's most intelligent. But that's not what happens if one puts the winners of a popularity contest at the helm of a country. One gets charismatic simpletons and shysters steering the ship.
Only two possible solutions existed: one man one vote and everybody seen as just a citizen, like Olive Schreiner wanted and now is the case, or self-determination for the whites in an area of their own. The first option guarantees that whites will at best be an insignificant minority playing an insignificant role in governing the country, like is happening now. At worst whites will be assimilated by the black masses like the Borg assimilated everyone in Star Trek. This means whites will cease to exist as a group.
There is no doubt that the group which should have done something when they could and should have educated the whites as to the true nature of the problem was the National Party, which already went the way whites are now going. They were in charge from 1948 to when they unconditionally surrendered to the ANC in 1994. If they were not to blame, who was? Disregarding facts in favour of slogans and ideas, they could not tell reality from wishful thinking. They hardly ever thought beyond the next general election. The voting cattle, for their part, could also not look beyond the immediate future, like is true for the squirming masses everywhere.
After looking at everything on this site, playing with the slider and getting a few population predictions, you'll agree that to call the future of whites in South Africa bleak is overly optimistic. But lest they feel sorry for themselves and see themselves as victims, they should remember that, when all is said and done, this is what they voted for in 1992. To claim they were fooled into voting for what inevitably put the ANC in the driver's seat is not an excuse. Being misled is based on ignorance.
But alas, everybody claims to be victims of some evil group and denies any responsibility for their plight. This is the story of the West these days.
Will their dwindling percentage of the population and the success of black political parties demanding seizure of white property, like the uMkhonto weSizwe party in the 2024 election, motivate whites to move?